GIS, that
stands for geographical information systems, means a way of storing and presenting
geographical information with the help of a computer. A GIS-program is able to demonstrate
geographical information and it is possible to calculate areas on objects or
use simulating data that has been collected on other occasions.
First steps
in the project were to identify all flads in the Kvarken region. This was done
by using aerial photography. The work was pretty time consuming, but a better
option than visiting all the flads in the area. In the end there were over 2500
objects that could be classified as some kind of a flad.
It is
impossible to visit 2500 flads and that is why a smaller amount was chosen for
closer investigation. To be able to get the most representing flads, objects
were chosen that differ from each other in different ways. Criteria such as location
on the coast, area and exposition (effect of waves and wind), but also the size
of the threshold were used. 33 flads in Finland and 18 in Sweden were chosen.
On 10 different locations also bats and insects were surveyed.
The thought
behind this is, that by surveying a small amount of flads of a certain type, the witheld information could then be interpolated on other flads with equal variables. One
such variable is salinity, that can directly affect the flads condition and
species distribution. Models that show salinity exist but they are mostly
applicable for oceans and not for areas that are more or less isolated from it.
It is possible to deduce the salinity of
a flad by comparing the size of the threshold, which affects income of salty
water, and the area of the catchment basin, that affects the amount of
freshwater entering the flad (Picture 2). Also the length of the shoreline
around the threshold has been calculated to obtain information about the
exposition (Picture 3).
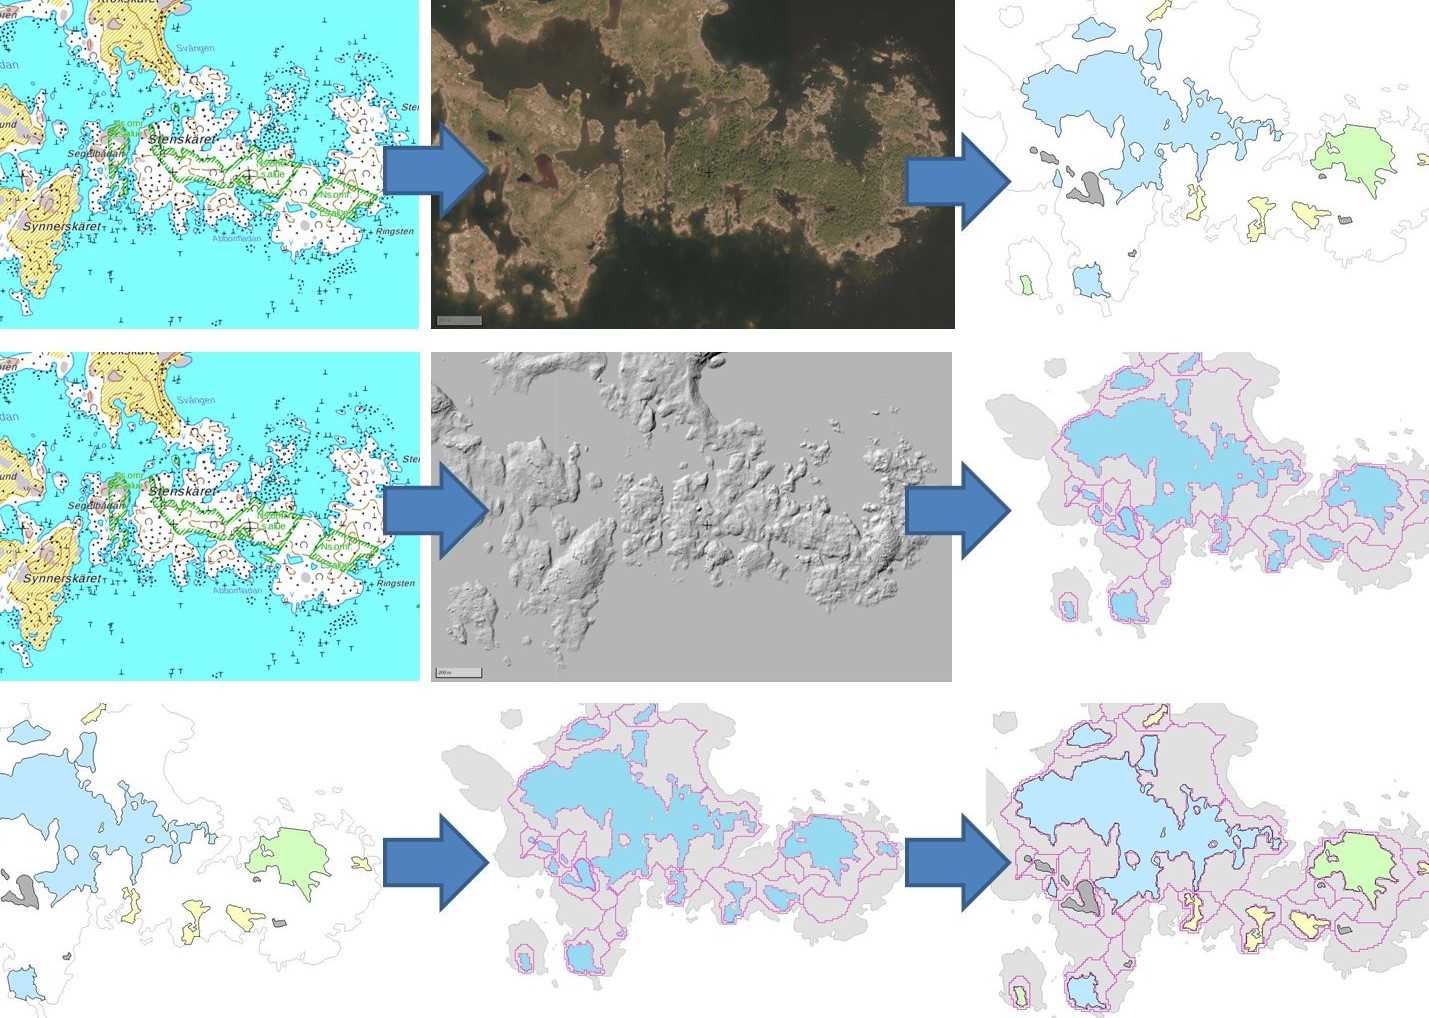
Picture 1. Examples of what GIS work includes.
By combining different map layers, you achieve interesting features. The upper
row shows a terrain map and an aerial photograph that are used to identify
flads and their development stages. Topography is used in the row in the middle
to calculate catchment areas for separate flads. The last picture shows the
combination.
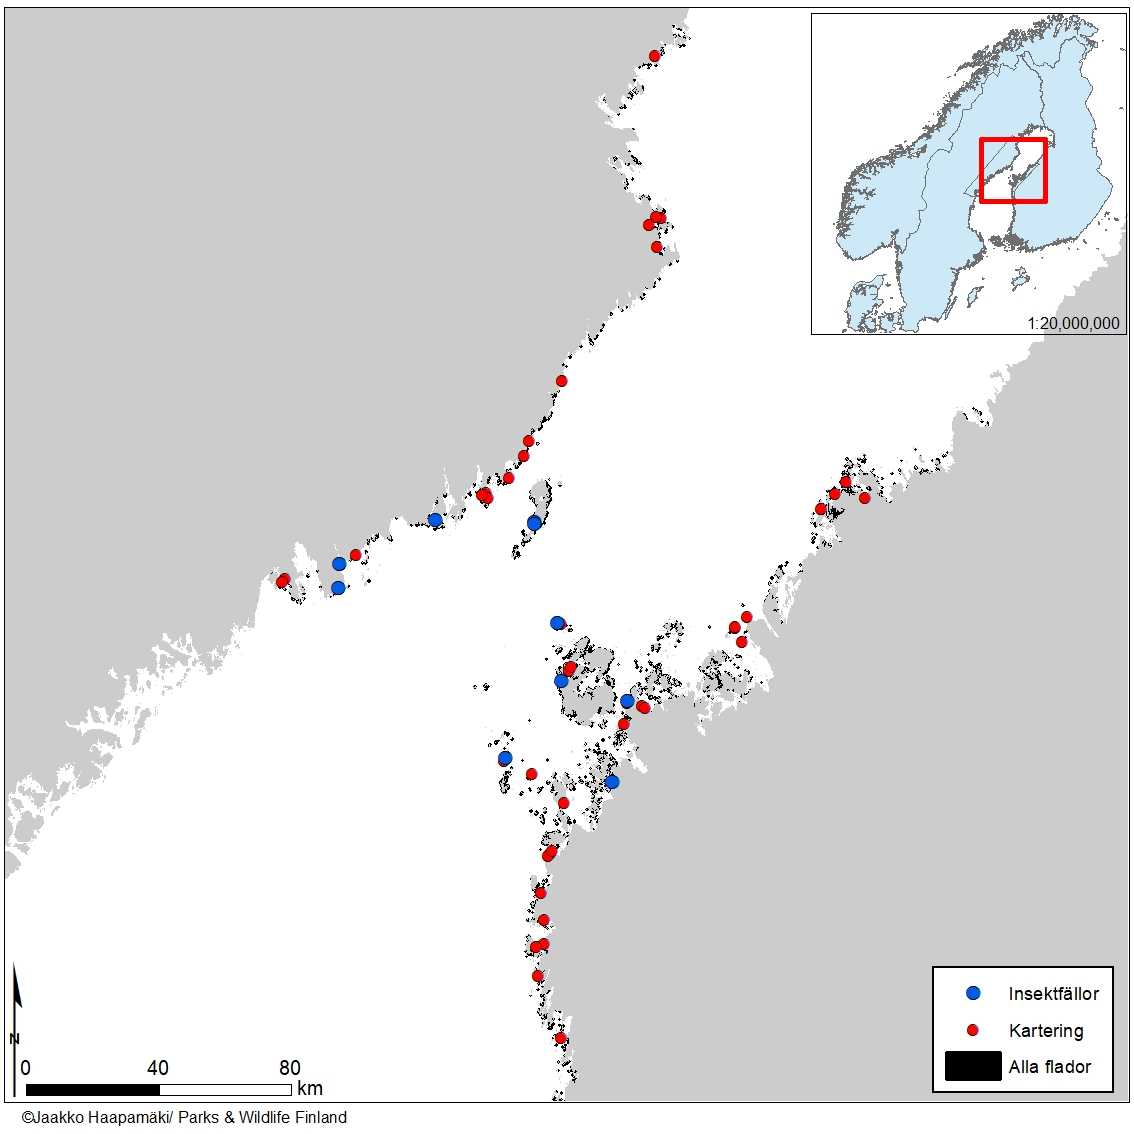
Map 1: All
bays that were chosen for vegetation surveys and insect and bats surveys.
Picture 2:
Five flads and their catchment basins. If there are several flads in a chain shall
their combined catchment basins be calculated (on the right). Bild 2:
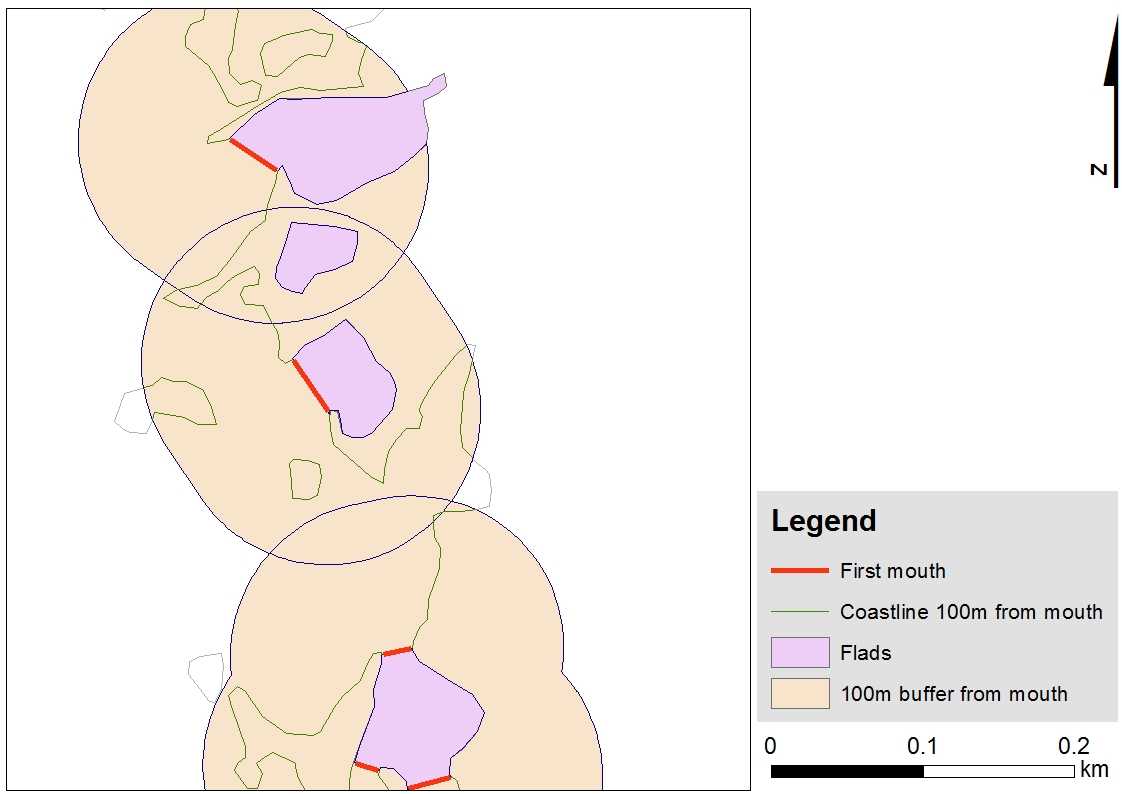
Picture 3:
The threshold on three flads and a 100m buffer to calculate the length of the
shoreline inside the area. The
length of the shoreline corresponds to the exposition.